Our detailed guide
How to Export Google Ads to Google Sheets (Without Coding Knowledge)
Last updated: September 18th, 2023

Dan Gurbalov
Digital Marketing Manager
Every experienced marketer recognizes the importance of proper data analysis. However, some of the information in Google Ads is not displayed in the best possible way for us to do a proper analysis. This poses a problem. Exporting data to Google Sheets is the answer. Well, half of it.
Thousands of digital marketers are chored with the tedious task of exporting data manually every day.
This ends today. Today is the day you get to delete the manual reports that have been bothering you for ages. You will learn how to export Google Ads data into Google Sheets automatically, within minutes, and without the need for any coding knowledge.
Use Cases of Exporting Google Ads Data to Sheets
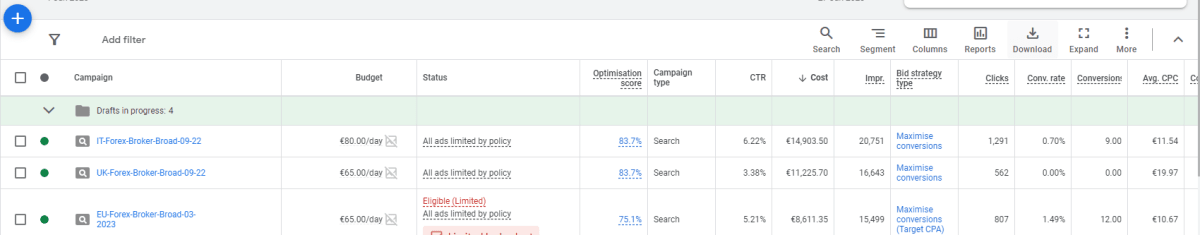
By exporting Google Ads data to sheets you can provide really detailed views on several campaigns at the same time. This gives you the flexibility to generate highly customized client-specific reports. There are several go-to reports every marketer must know and you can generate.
1. Client Reporting
If you are a freelance marketer or a Google Ads manager running campaigns for various clients, eventually you will have to walk your client's campaign by campaign and explain your strategy, results, and Google Ads optimization processes. While Google Ads offers some reporting features, using sheets gives us the flexibility to generate custom-tailored reports, share them, and include the specific metrics your clients want to see, without much clutter.
Looking at this from another angle, most non-technical clients prefer to see data in the already very familiar Excel table format. Transparency is key when working with clients, and instead of them having to request reports from you every time, you can set up automatically scheduled data exports. This is the best transparency you can give them. Timely and error-free, too.
2. Internal Performance Monitoring
Internal performance monitoring is the backbone of optimizing your ad spend and campaigns. If you are working with a single large client or employer, you can give each campaign the attention it requires.
In this case, you can treat the management, or your superior as the external client in the previous use case. Provide them with up-to-date, automatically updated granular reports on whatever KPIs are important for them.
Why Should You Export Google Ads Data to Google Sheets?
Google Sheets offers far greater flexibility for reporting. Custom dashboards, visualizations, and easy sharing with stakeholders are all possible. Everything can be automated, eliminating the need for any manual intervention whatsoever.
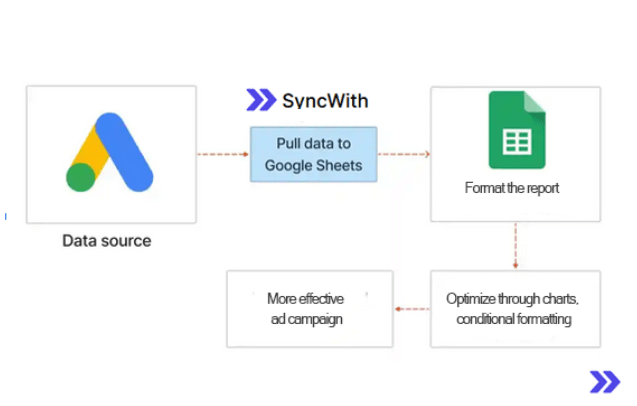
You may utilize Google Sheets as an analytics dashboard and backup database for your company. To have everything in one place, import data from additional sources besides Google Ads. For instance, SyncWith’s data-importing tools, allow you to export data from Shopify, Facebook Ads, Google Analytics 4, Google Search Console, Microsoft ads, TikTok ads, and even LinkedIn ads.
For instance, with the SyncWith tool, you can export Google Ads, Google Analytics, Facebook Ads, TikTok, and Instagram, all at the same time and even in the same sheet if needed.
Analyzing Data Through Charts
Once you’ve set up reports in Google Sheets, you can generate charts, based on which you can easily spot irregularities, outliers, and problematic behaviors. This can be used for budget allocation, as each campaign spent and ROI can be calculated in the same table.
Multiple Accounts Optimization
With the help of Google Sheets, you can easily monitor and optimize the data from several accounts in the same spreadsheet or different tabs. And all of that can be done automatically via scheduled updates of the reports you want to create.
Scheduled Automatic Updates
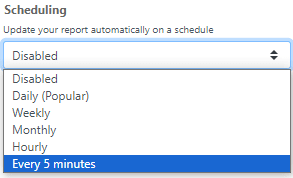
With the help of SyncWith, based on your needs, you can schedule all of your reports to automatically update every:
- 1. 5 Minutes
- 2. Hour
- 3. Day
- 4. Week
- 5. Month
Imagine having to run 5 reports each day, and it takes you an hour to do so. By automating this process you would save 33 work days in just one year. Instead of wasting these 264 hours, SyncWith can update the reports based on your schedule and save you all these hours.
Exporting Google Ads Data Manually VS Automatically
You can read in detail how to export data manually through your Google account. The whole account can be exported by going to the Accounts menu > Export >Whole Account or selecting campaigns and ad groups. But this is viable to do, only if you are doing it once or if you are exporting different campaigns each time.
Otherwise, if you think your client or manager will need an updated version of this report, performing an automatic export is the smart go-to. Because compared to the manual one - each subsequent time you export something it takes you less than a second. While the former can take you minutes or in some more complicated cases - hours.
Different Methods of Exporting Google Ads to Sheets
There are four popular options to export Google Ads data to Google Sheets.
- 1. Download a CSV file or download it to Google Sheets.
- 2. Set up SyncWith in 2-5 minutes and let it do everything automatically.
- 3. Try third-party solutions.
- 4. Utilize a script in Google Apps Script coding language and utilize the Google API.
The 1st option is very easy to do but if you have to do it more than once it gets borderline tedious.
1. Method 1: Download CSVs or Downloading Data to Google Sheets
To do that, go to your preferred view in Google Ads, hit the download button, and select either CSV as the export option or Google Sheets. You can download the CSV and re-upload it to Google Sheets. It will format it on its own.
You will be able to see the option to download directly to Google Sheets.
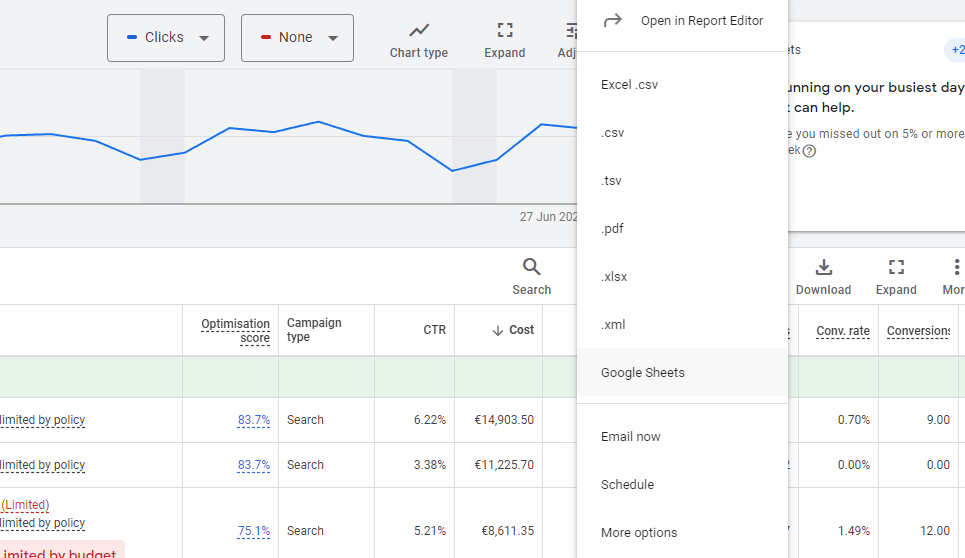
If you don’t see it here, go to “More options” and Google Sheets will appear there. There are several problems with this export, however.
First of all, exporting several views this way will take a lot of time for you to set them up before export. And more importantly, there is no way to update these sheets. You will have to re-export every single time you want to update anything.
2. Method 2: Setting Up SyncWith to Work Automatically for You
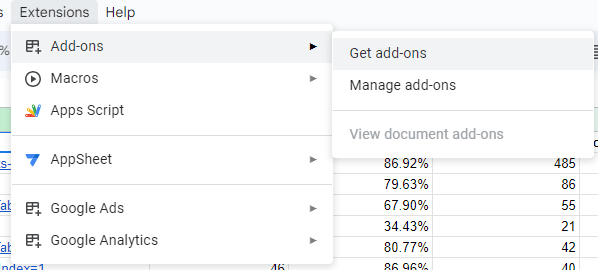
You have two options. Either go to your Google Drive and open up Google Sheets, then go to Extensions > Add-ons > Get add-ons, or go to the SyncWith website and initiate the process from there. In either case, you will need to log into the Google account you also have access to the Google Ads account you are managing.
Type in SyncWith in the search bar, and navigate to find theSyncWith add-on, it is usually positioned at the top.
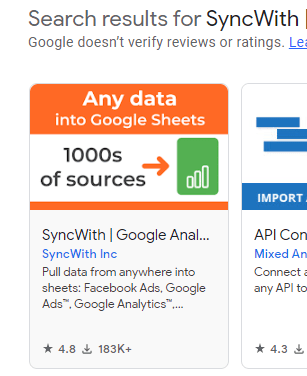
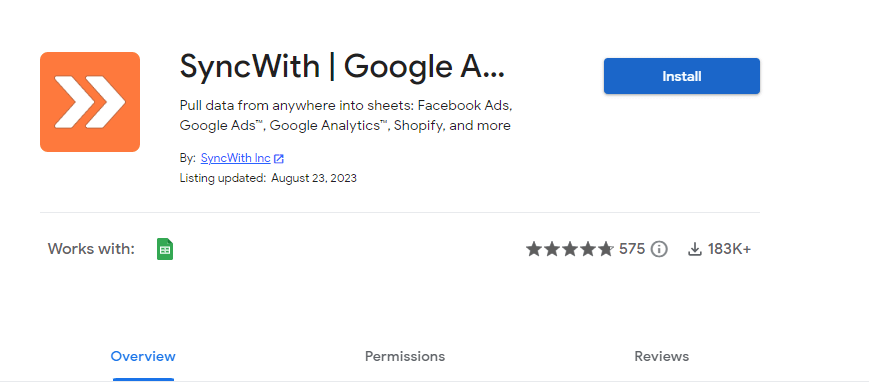
Hit install and give the required permissions to the add-on. After installing the add-on you will see it in the Extensions tab.
Click on it and Get started.
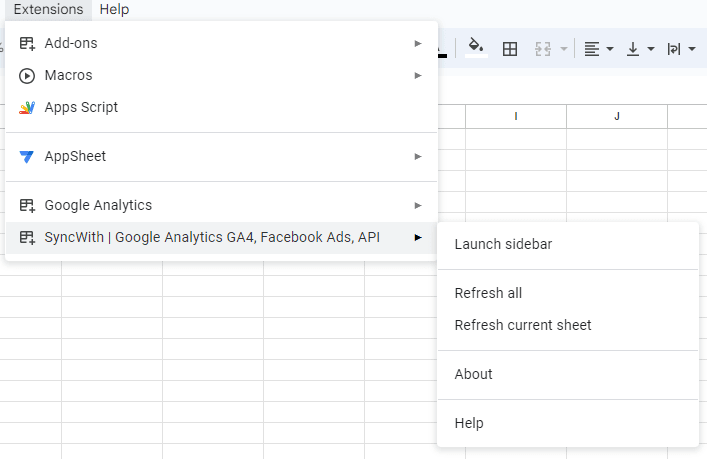
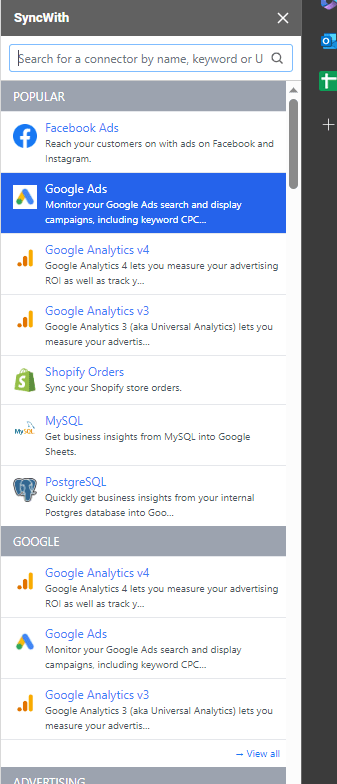
Once you’ve done it, launch the sidebar, and connect your Google Ads account, give permissions, and select Google Ads below.
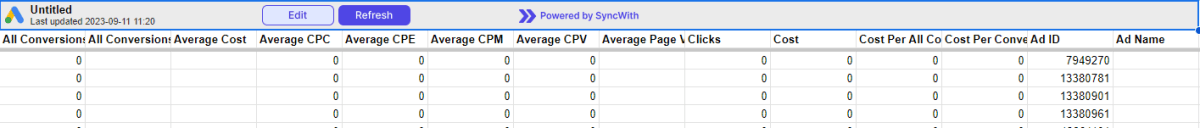
Afterwards, you can export whatever data you wish. Once you set up a report with the desired dimensions and metrics, you can reuse it anytime, and you can choose a time for it to automatically update.
It is important to set up metrics and dimensions that work together. Otherwise, you will encounter an error. After you’ve done that, you can edit and refresh the report at any time from the upper bar. For example, you cannot export average CPC, or conversion, without exporting the Ad ID or campaign name that they belong to.
3. Method 3: Using Other Third Party Solutions
There are a few other third-party solutions you can explore, but unfortunately, most of them require a paid account to update your data automatically, while SyncWith provides automatically scheduled updates for every user free of charge.
You can always use multiple solutions at once, as Google Sheets allows for many add-ons to run simultaneously but this is not a recommended practice.
How Often Should Your Scheduled Updates be?
Depending on the use of your report, it can be updated every few minutes, every hour, daily, or weekly. For optimization purposes, one of the best practices in digital marketing is to update reports either daily or every few hours.
You can schedule the daily updates according to your daily activities. Otherwise, if you are working with a monthly report that you have to present to a wider audience, e.g. a board meeting, then you can refresh the report weekly or manually. It is also a good idea to update your reports at least 10 times more often than you update your campaigns. This will give you enough granular data to make the right decisions.
By going to the scheduling tab, you can choose from the following options:
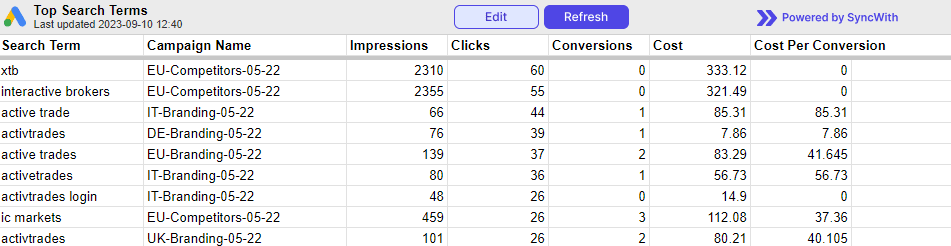
In case you are doing the daily update, you can check the exact time of the last update in the generated status row above your report.

In case this doesn’t suit your needs, and you want up-to-date data, you can always refresh this report by hitting the refresh button next to Edit.
How to Quickly Analyze Google Ads Data in Google Sheets?
Now that you’ve successfully exported the data, it’s time to analyze it. In Google Ads, conditional formatting doesn’t exist. But if you export all your data to sheets you can map each field and column. Only then, you will be able to easily filter and distinguish what is performing well, and what isn’t.
The automation, formulas, and conditional formatting that exist in Google Sheets are some of the main reasons why professional digital marketers prefer analyzing both granular and macro data in Sheets and not in Ads or Analytics.
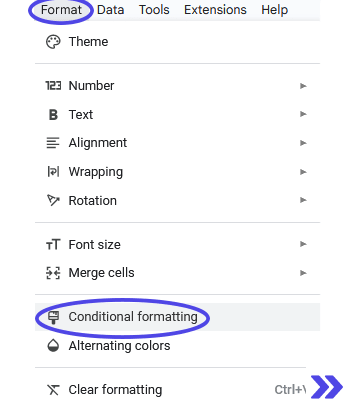
After you’ve exported your data successfully using SyncWith, go to the sheet’s tab, to which you exported, select a data range you would like to compare, and go to Format > Conditional Formatting.
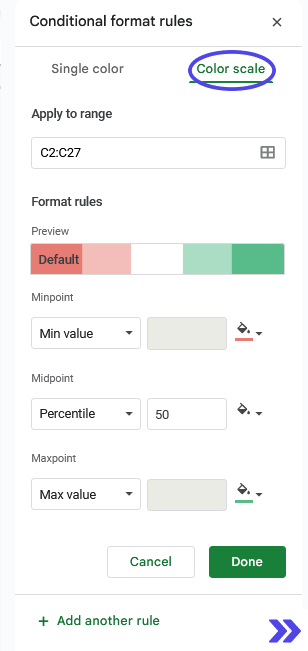
After you’ve done that, switch to the color scale, and select the most appropriate for your specific case. Adjust the minpoint, midpoint, and maxpoint if needed, and hit “Done”.
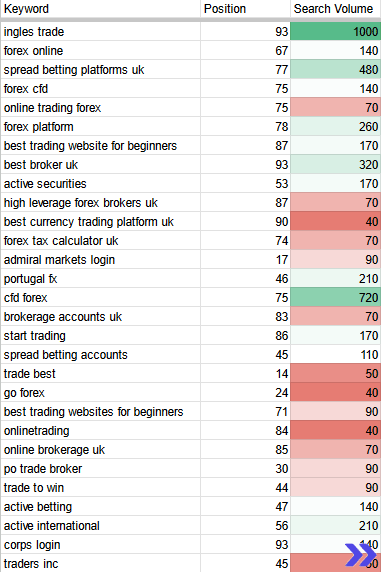
After you’ve set up conditional formatting, eventually you will see a table that analyzes the results in a raw format based on value. If you’ve set up your daily updates, then with each update in the table data, this conditional formatting will also change by itself. It allows you to see how the data changes in real time. Instead of looking at hundreds or thousands of numbers and filtering and formatting them, you will just check the intensity of the color and instantly spot the differences.
In the case demonstrated below, we used SyncWith's add-on in Google Sheets and exported data from Google Analytics to compare organic search volume. But you can practically compare any metric this way.
Adding Filters And Charts to Your Exported Google Ads Report
After you’ve successfully exported the desired data with SyncWith, you can proceed to add filters, charts, and conditional formatting as explained in the previous point.
Select the uppermost row in your table with the exported dimensions and metrics and go to Data > Create a filter.
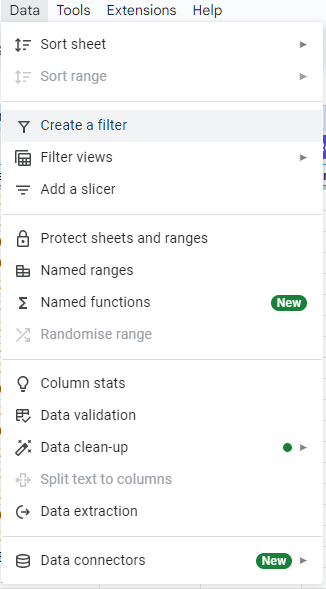
This way you can filter by any dimension. This is quite useful in the creation of charts in the top 10 performing campaigns, keywords, or impression count.
Select the two columns you would like to present in the table and without breaking the selection go to Insert > Chart.
By going to the panel on the right, select the chart type you think would best represent the selected data.
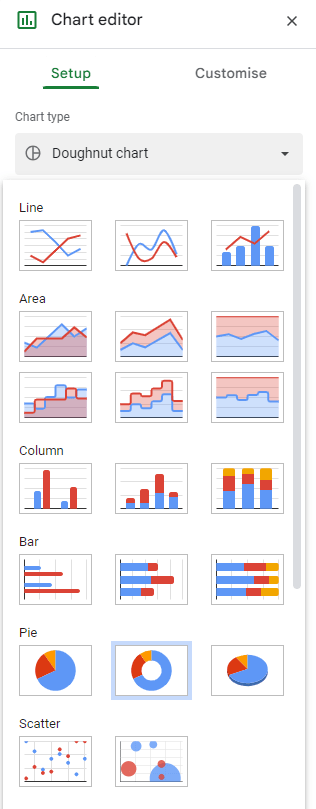
In our case, we are aiming to present a proportion of the whole, so we are going with a Pie chart here.
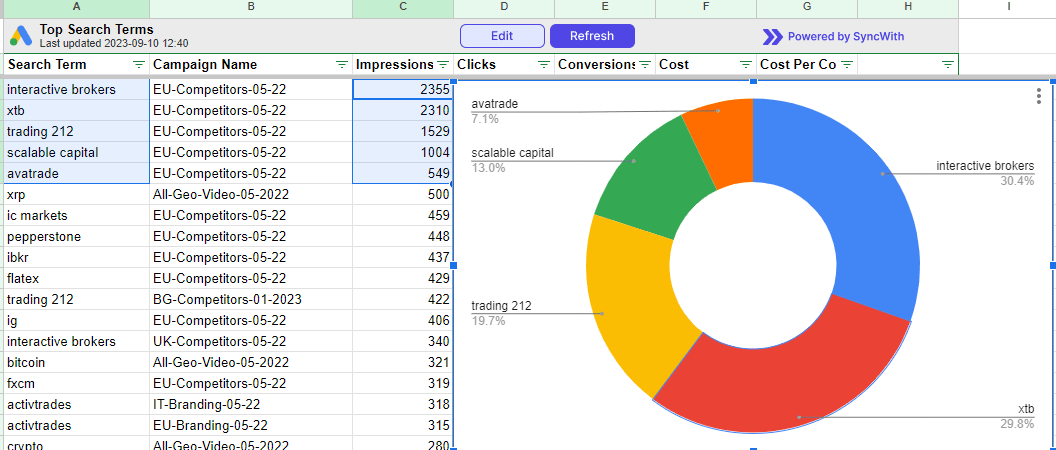
This chart will update dynamically based on the data in the exported table. Every time the data refreshes, the table will be up to date. You can create charts on a separate sheet and devise an informative dashboard for your shareholders with information like CPA, CPM, ROI, budget allocation, top-performing keywords, traffic channels, and so much more.
Once you set up a solid template, you can easily duplicate it and use it for another client. The only thing You have to remember to keep the dimensions and metrics in the same format and sequence.
Export Your Google Ads Data With SyncWith Today
Data is the essence of the digital marketing industry, and your ability to harness that data may be the difference between failure and success. We have discussed the difficulties and potential errors associated with manual data exporting from Google Ads to Google Sheets.
The best time to start exporting data with SyncWith was yesterday. The second best time is now. Our potent technology can completely alter the way you manage your Google Ads data. You can easily build personalized, eye-catching reports with SyncWith, schedule changes, and automate the export process.
Why wait? Experience the impact SyncWith can make in your digital marketing efforts. Delete your manual data exports, and welcome a new age of growth, accuracy, and efficiency.
Questions, comments?
-
Alexander Johansen
Hi, Great article! I've been using conditional formatting in sheets for a long time with manual reports, I only have a question for SyncWith, if I wish to refresh the report every day is it expensive?