Our detailed guide
How to export Facebook Ads to Google Sheets
Last updated: August 16th, 2023

Trey Edwards
Digital Marketing Strategist
Accurate reporting is essential to running effective marketing campaigns. In this article, we will show you how to use Google Sheets to combine data from multiple Facebook Ads accounts and campaigns into one easy-to-use reporting dashboard.
As professional digital marketers, one of the most important parts of our job is being able to effectively and efficiently build reports that help us, our clients, and our employers visualize data and track our progress towards business goals by using Key Performance Indicators (KPIs).
The Facebook Ads Manager is one of the most recognized and accessible tools for tracking the performance of our digital campaigns.
However, there are three main reasons why the Facebook Ads Manager dashboard isn’t an effective tool for reporting and analyzing data, both internally (for ourselves) and externally (to clients).
- It is unfriendly. If you aren’t a digital marketing professional, it can be very difficult to navigate, understand, and manipulate the data inside the Facebook Ads Manager.
- It is unfamiliar. Facebook does not have an easy way to create reports that are easy for people to understand unless they spend a lot of time in the Facebook ecosystem. The reason why people hire us to run their digital ad campaigns is because they are unable to do it. Oftentimes this means that the people we need to communicate results to are not very with the Facebook platform.
- It is inflexible. We need to be able to combine data from multiple sources when creating reports. We also need to be able to visualize that data in the form of charts, graphs, etc. Neither of these are an option inside the Facebook Ads Manager.
These three difficulties create unnecessary friction when key decision makers are trying to obtain updated metrics in order to track their progress towards specific business goals.
As digital marketing managers, it is our responsibility to compile and prepare the relevant data for those decision makers in an easy-to-understand way. We need to be able to visualize the data in a helpful way and eliminate distractions by removing unnecessary information.
The best way to do this is to put the data in a format that is much friendlier, familiar, and more flexible. Virtually everyone in a corporate business environment is familiar with spreadsheets, so Google Sheets is a very common tool for this - particularly because you can easily share dashboards with other people that update live, instead of having to re-download and re-send those dashboards every time you add new data.
How do we effectively export our Facebook Ads data to Google Sheets?
Data from Facebook Ads can be exported to Google Sheets in three ways: manually, by programming complex scripts, or by automating it using a tool like SyncWith.
How To Manually Export Data From Facebook Ads To Google Sheets
To manually export our data from Facebook Ads to Google Sheets, we will need to:
- Export our data from Facebook Ads Manager
- Format the data
- Upload our data into a Google Sheet
Step 1: Export our data from Facebook Ads Manager
We have two options here. We can either export it directly as a .cvs or .xls file, or we create a custom report. Both options can be selected using the Reports dropdown menu on the upper right-hand side of the Facebook Ads Manager.
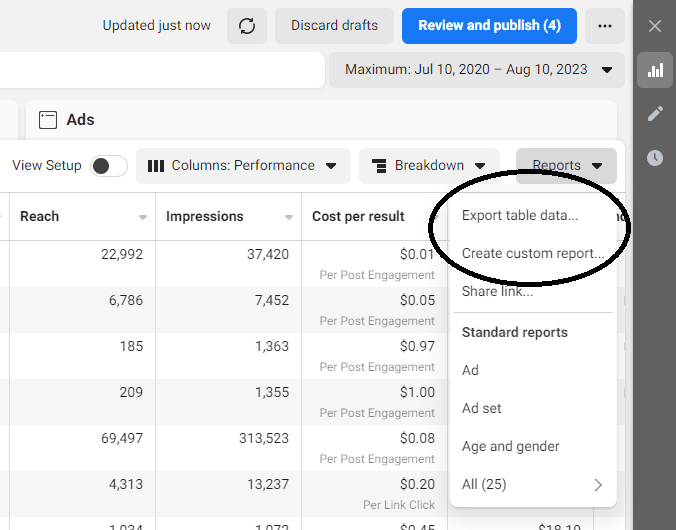
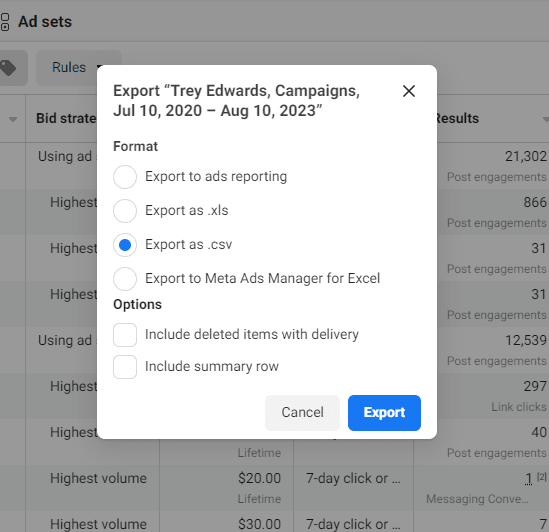
Exporting the data as a .csv or .xls file will export the data that we currently see on the dashboard, in the order that we see it. To do that, simply click “Export table data…,” select your file type, and hit “Export.”
To customize the data before exporting it, choose “Create custom report…” instead.
This will take you to a screen where you can customize the breakdowns and metrics in a pivot table before exporting:
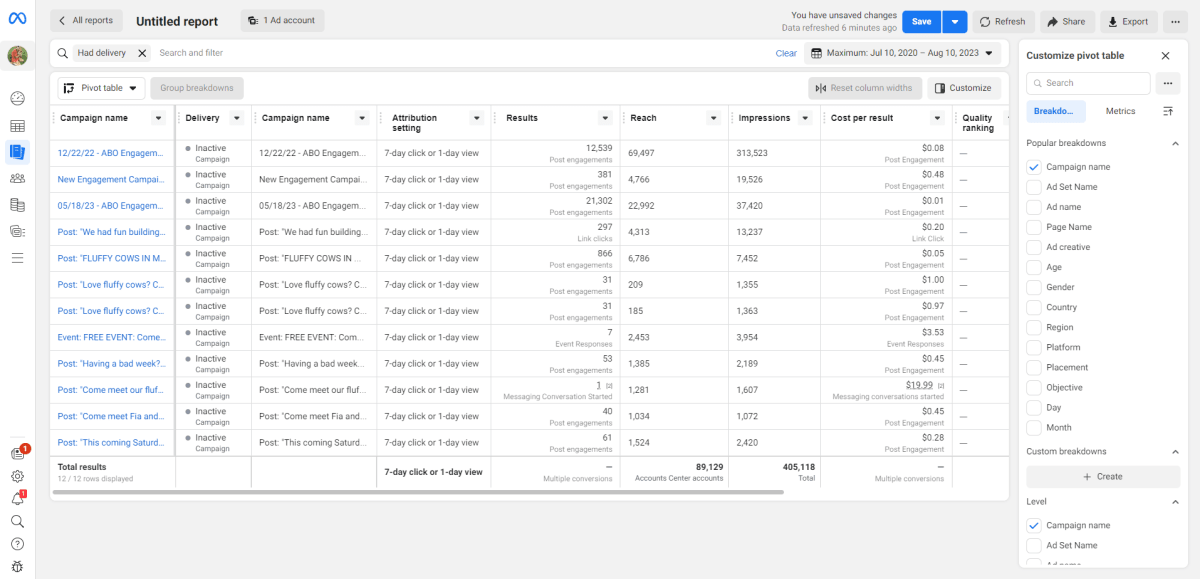
You can choose your variables on the right-hand side. You have a lot of control here about how things are sorted, filtered, and customized - but that’s a topic for another walkthrough. Once you have customized your report, you can save it inside the Ads Manager using the “Save” menu options (big blue button) and export it using the gray “Export” button on the top right-hand corner.
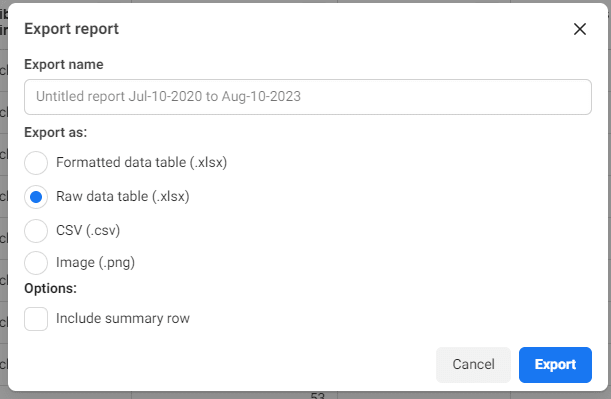
When you export this report, you will be asked to choose what format you would like the data exported to.
If you choose .csv as your format, keep in mind that some of your formatting and structure may be lost. However, this is the most compatible option and will work with virtually any software.
If you plan on importing this data into the latest version of Excel, you can choose the “Formatted data table (.xlsx)” option, which will make your data more visually appealing.
If you are planning on importing this data to Google Sheets, you should choose the “Raw data table (.xlsx)” option. This keeps all the data without the fancy Excel-specific visual formatting, some of which is incompatible with Google Sheets.
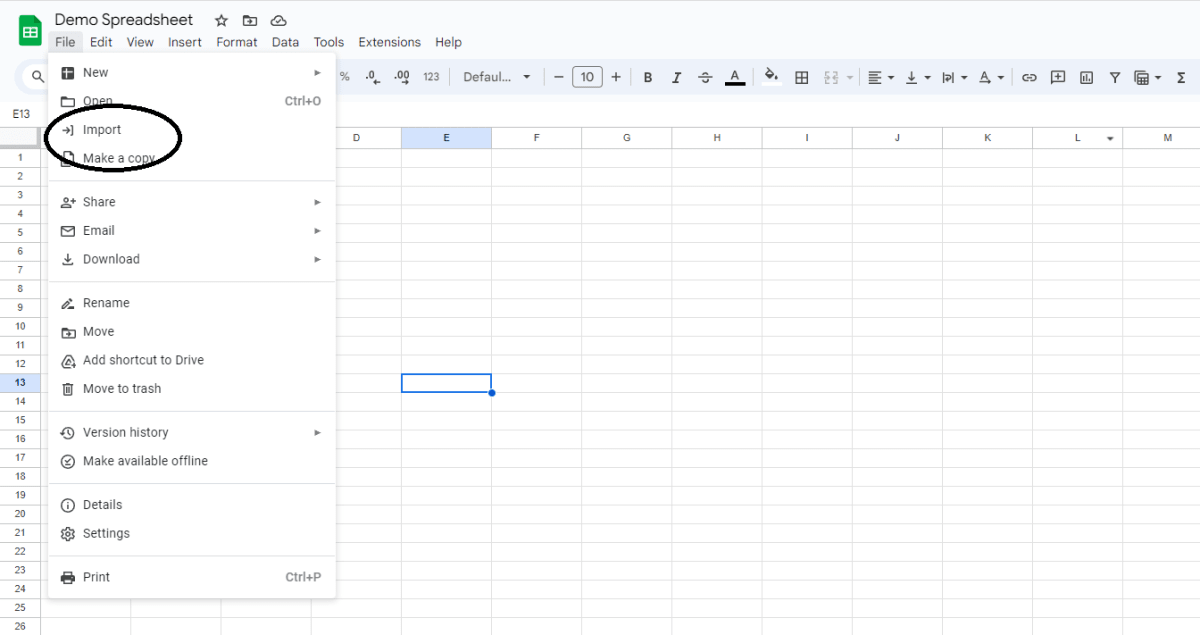
Next, pull up Google Sheets and open a new document. Click File > Import.
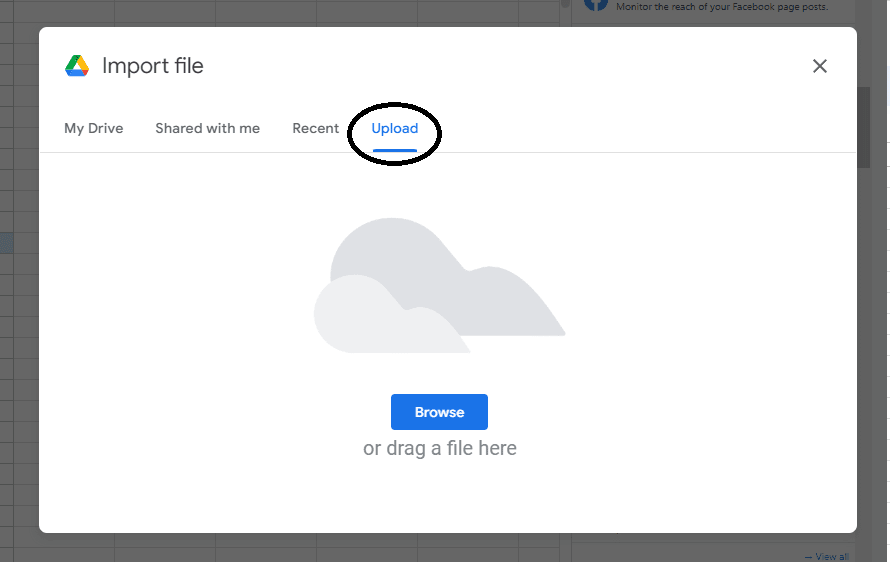
Choose “Upload” and select the file on your computer.
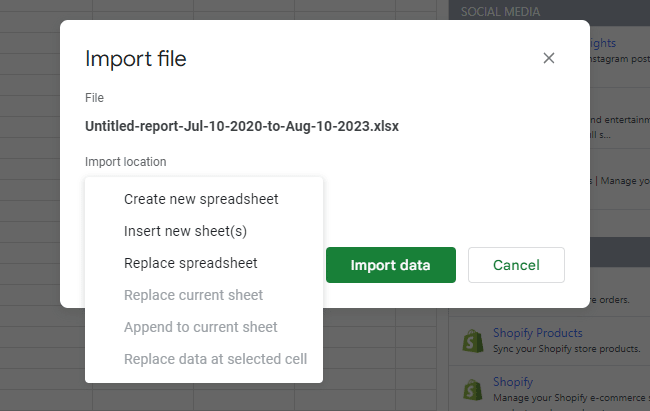
You will be able to choose if you are wanting to create a new spreadsheet, insert your data into a new sheet on the current spreadsheet, or replace the current spreadsheet with the data you are uploading.
Congratulations! You have manually exported your Facebook Ads data to Google Sheets. Your new spreadsheet should look something like this:
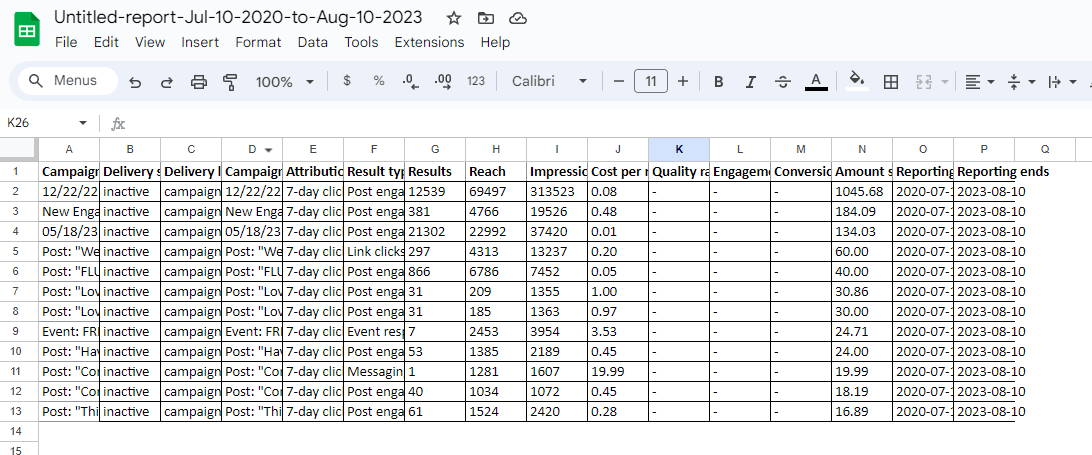
From here, you will need to manually format the data and create visuals (charts, graphs, etc) with it.
How To Automatically Export Data From Facebook Ads To Google Sheets
Manually exporting your data isn’t terribly complicated.
However, it is a manual process that is extremely time consuming if you have to do it on a regular basis - especially if you have more than one ad account that you are working with!
Once your data is uploaded to a sheet, you then have to manually format all your data and create all of your visuals. Time is money - how much time per month will you spend doing this manually?
We’ve already established the need to get your data from the Facebook Ads Manager to Google Sheets - to make a friendly, familiar, and flexible reporting dashboard that combines data from multiple sources in a way that allows key decision makers to easily evaluate the performance of their digital marketing efforts.
So, how do we automate this process?
There are two ways to automate this export process:
- Write a script that uses the Facebook Ads API to do it. This will save time in the long run, and can be affordable if you already have dedicated programmers on staff. However, if you are a smaller organization without dedicated programmers or you would like a process that is easy for more members of your team to understand, this isn’t the most convenient option.
- Use a third-party tool like SyncWith. Anyone with an intermediate level of Excel/Sheets knowledge can use this tool to quickly create reports from multiple data sources that automatically update, and you can create cover sheets and dashboards with visuals that only need to be created once instead of every time the data is updated. There is a cost associated with this tool if you use it extensively, but it does have a free entry-level version that you can use to determine if it will save your organization more money than it will cost. (hint: it probably will!)
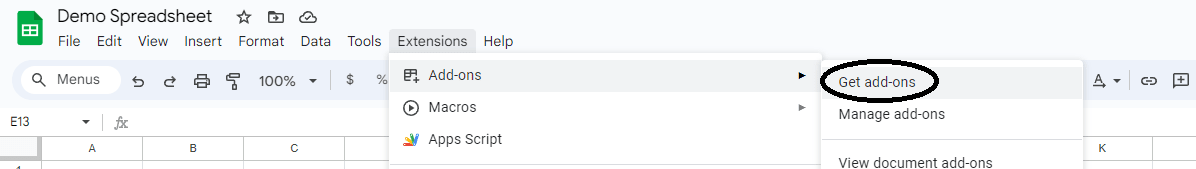
To install SyncWith to your Google Sheet, simply open a new spreadsheet and select Extensions > Add-ons > Get add-ons.
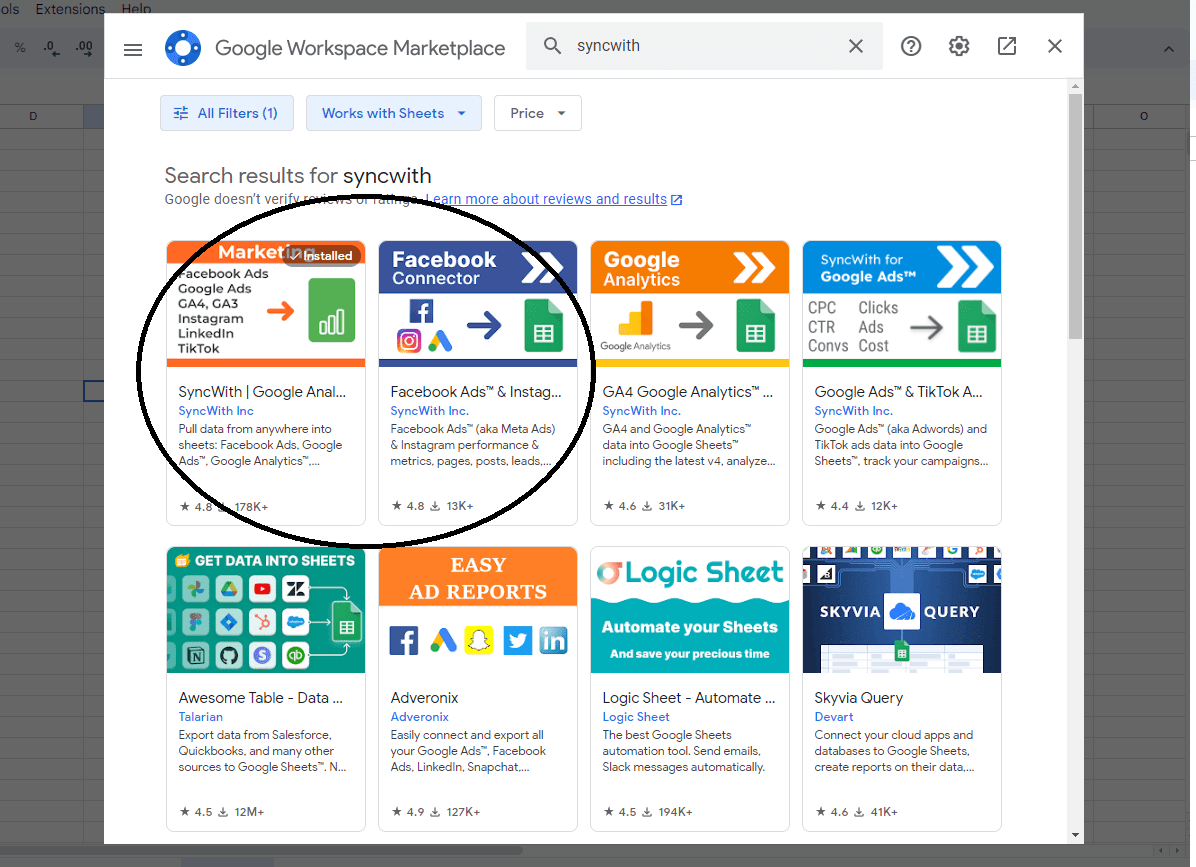
This will load the Google Workspace Marketplace. Use the bar at the top to search for SyncWith and install the SyncWith Google Sheets addon. All you’ll need to do is grant the app permission to connect, and it will immediately install, once installed you can use it to export Facebook Ads to Google Sheets automatically.
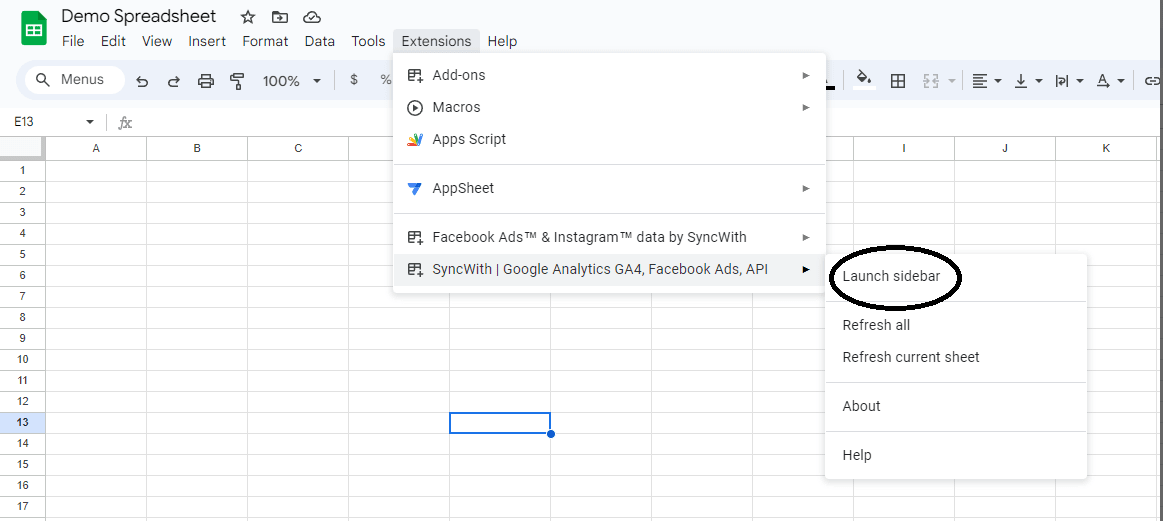
Now that you have installed one or both of these apps, you can find them in your “Extensions” dropdown on your toolbar. Click “Launch sidebar” to start importing your data. For this tutorial, we will be using the version of the app that allows us to connect to other data sources as well.
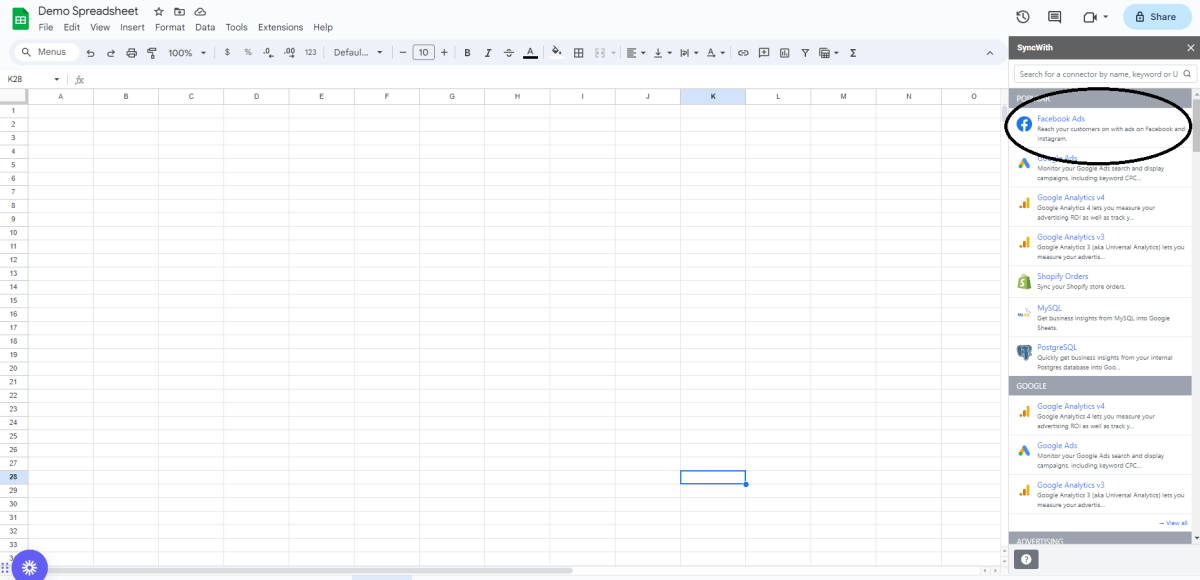
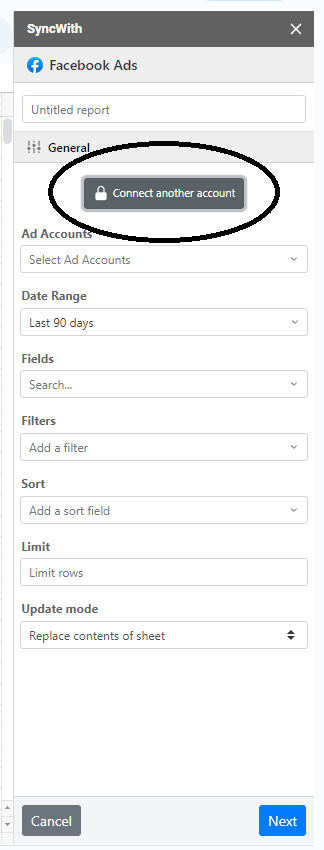
This will open up a sidebar on the right. This sidebar is where you will set up all of your connections and new reports. You will still be able to edit, format, and create visuals for your data on the rest of the screen. To start importing Facebook Ads data, select the “Facebook Ads” option.
Like with all Google Sheets, you will be able to share these reports with people both inside and outside your organization as you choose. And the best part is, they will update live - no more manual work!
The first thing you’ll need to do is connect your Facebook account. Select “Connect Account” and go through the authorization prompts (mine is already connected so it reads slightly different).
Now, this is where the magic happens. After you have connected your Facebook account, you can add as many or as few ad accounts to each report as you’d like, as long as your Facebook account has the appropriate permissions level.
Next, select your date range. This works slightly differently than the Facebook Ads Manager. On Facebook, if you select “Last 30 Days,” it does not include the current day. However, on SyncWith, it does include today. That’s important to remember if you ever notice discrepancies between your SyncWith data and your Facebook Ads Manager dashboard. You can always manually adjust your dates on either side to make the numbers match.
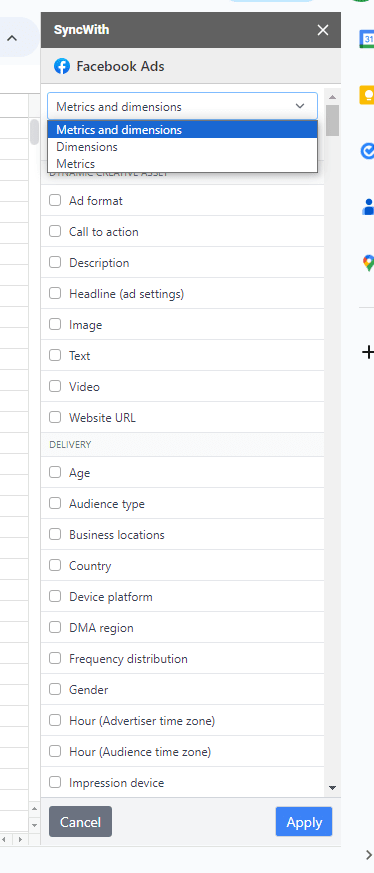
Next, select the fields that you would like to display. In most cases, you will need to select at least one dimension (date, campaign name, ad account name, etc) and one metric (reach, impressions, cost, etc) for the data to be of any use. If you click on the “Fields” search bar, you can see all of your options, as well as choose if you want to see only metrics, dimensions, or both.
I am going to select “ Account Name, Campaign Name, and Day” as my dimensions. This means that it will break down all of my metrics by these three dimensions.
Note: You must select either Day, Month, or Week if you want it to break the data down by any kind of time frame - otherwise it will just show the sum of all data for the period selected.
As we add in the relevant dimensions and metrics that we want to track in this report, we have the option to re-order them by dragging the three dots on the left hand side of each one up or down.
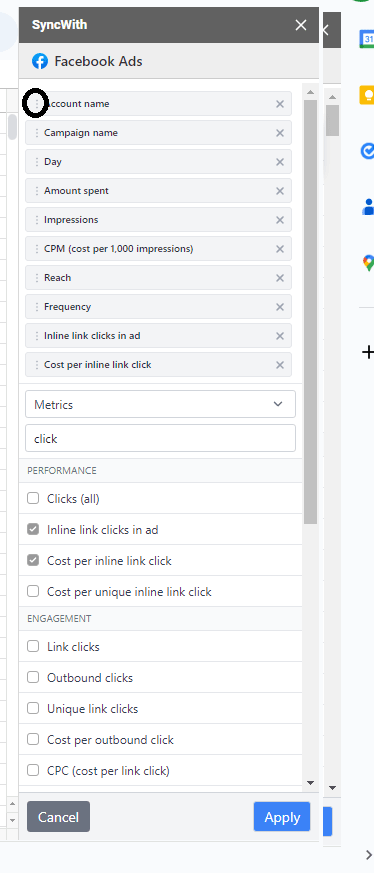
Once you have chosen what you’d like to include in your report and how you’d like it ordered, click the blue “Apply” button.
You can also filter and sort your data. Personally, I usually like to filter out inactive campaigns by using the following options:
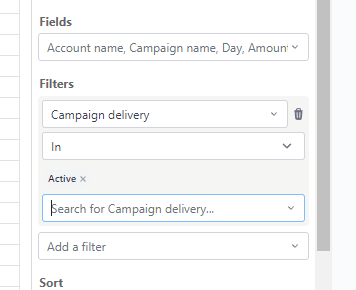
You can set up pretty much any filter you’d like. Play around with it and see all of your different options. You can even create multiple filters on each report!
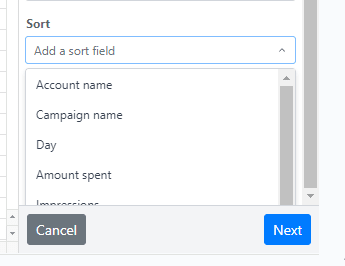
Next, you can choose how you want your data sorted, by selecting one of the fields you added earlier. You can choose to sort each field in an ascending or descending direction as well as organize multiple levels of sorting.
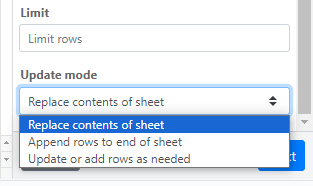
Your final two options are pretty simple: You can choose to limit how many rows are imported, and you can choose if you would like your data to replace, append, or update the existing data on your sheet.
On the next screen, you will select from some additional optional sheet settings:
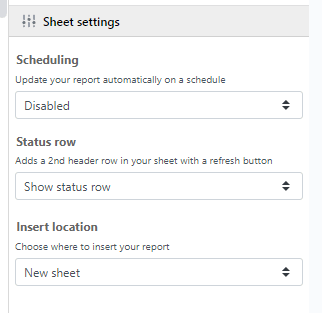
The most important one of these for the purposes of this tutorial is “Scheduling.” You have the option to update your report automatically on a daily, weekly, monthly, or hourly basis. You can even choose to have it updated every 5 minutes! Keep in mind though that you have a limited number of refreshes on the free and lower-level paid plans, so don’t set it to update more frequently than you can afford!
Finally, you can choose to add a status row, as well as where to insert your report the first time.
Once you have made your final selections, click the blue “Insert” button at the bottom.
It will take a few seconds for the report to generate, then you should have something that looks like this (account names obscured for privacy reasons):
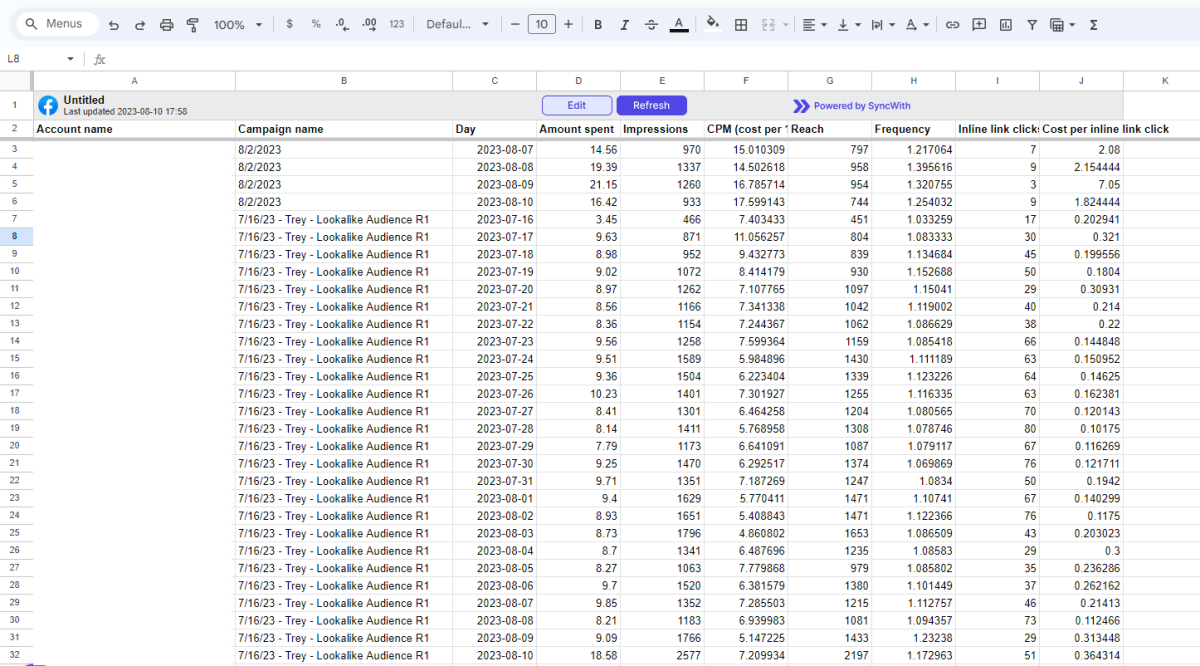
If I had not selected a time frame as one of my dimensions, I would only have one row for each ad account. This is very handy for easily seeing the top-level performance of all of your ad accounts at once, which is useful for agencies, but less relevant for internal marketing teams.
From there, you can create a new cover sheet and use it to build out charts and other visuals based on this imported data. Every time the data refreshes, your charts will too. Leave a comment on this article if you would like us to do a walk-through on creating helpful and visually appealing charts in Google Sheets!